Designing Complex Data Tables
Complex data tables are a staple in enterprise softare, but designing them effectively can be a significant challenge.
Further Reading
- Accessibility at Penn State - Complex Table HTML
- WebAIM - Creating Accessible Tables
With strategic planning and a few clever techniques, we can create tables that are not only functional but also user-friendly and appealing.
Here's how to transform data complexity into a seamless design.
1. Plan Before You Design
Before diving into design tools like Figma, it's crucial to thoroughly understand the intricacies of the data you're working with.
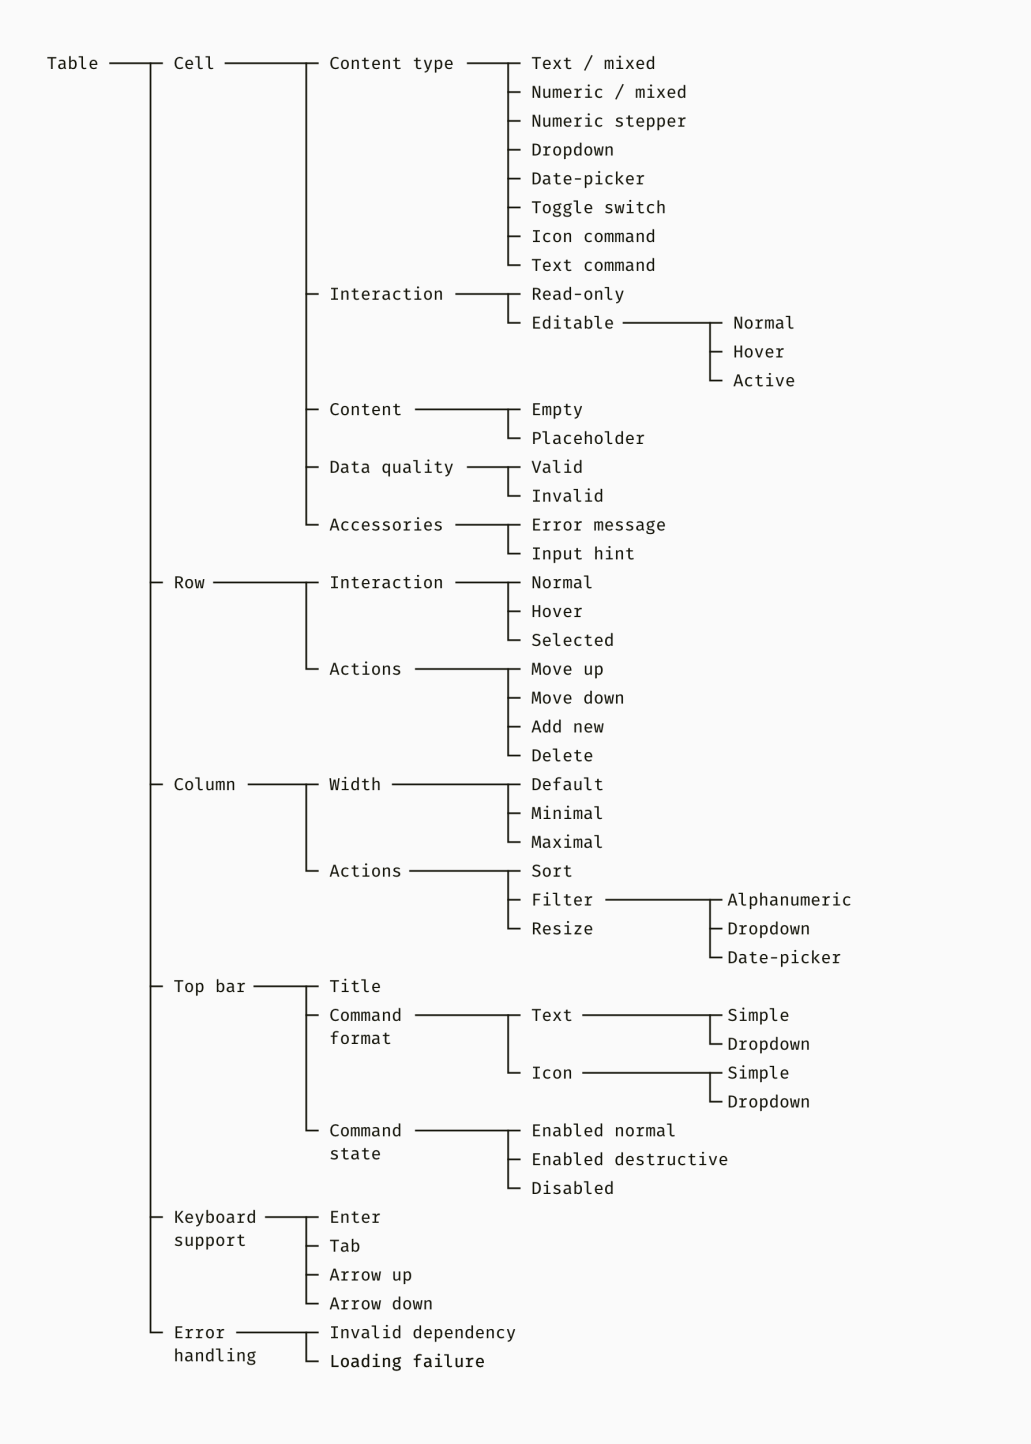
Designing complex data tables requires careful planning to ensure they meet both functional and user experience needs. Some designers recommend creating a table tree diagram to outline all features, states, and additional elements—providing a visual blueprint that helps identify potential issues early in the process.
Click for a larger image, it will open in a new tab or window
Key questions to ask:
- What functionality do users actually need? Drag-and-drop? Resizing? Multi-sorting? Remember: draggable controls must be keyboard-accessible due to WCAG 2.2 AA requirements.
- What types of data will each column contain? Not all data is created equal. Some cells might be read-only, others editable. Plan this out early.
- What actions will the users perform on this data?
If you're working with an existing table, start by pinpointing what's working—and what's not. This checklist (pencilandpaper.io) is a great place to start.
2. Prioritize Clarity and Flexibility
When dealing with complex data, it's tempting to show everything at once. Instead, prioritize what users see first and find creative ways to progressively disclose additional information.
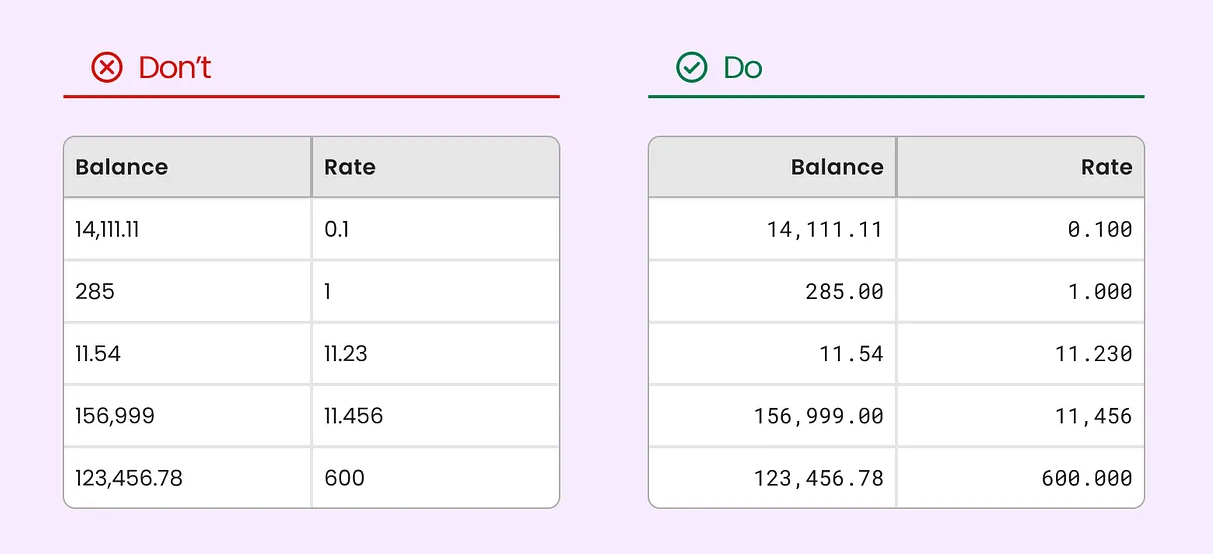
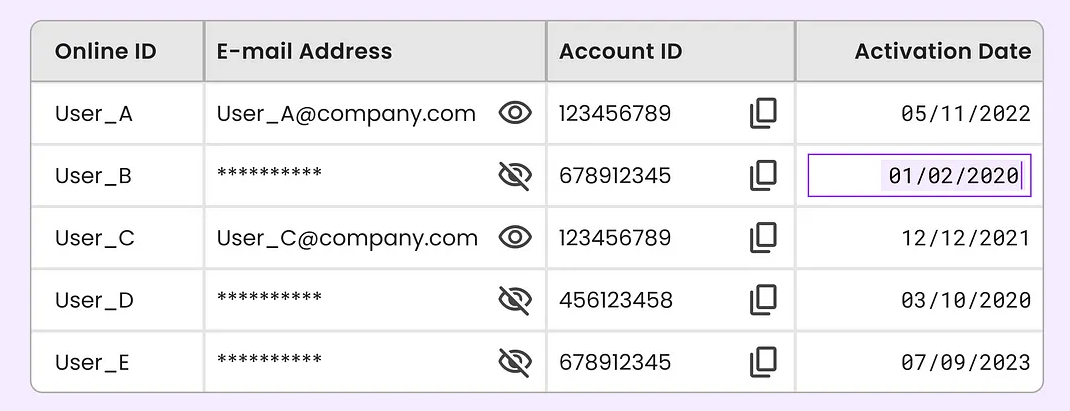
Make data understandable:
- Right-align numbers and use monospaced digits
- Use subtle background colors for headers
- Bold primary identifiers (Names, IDs)
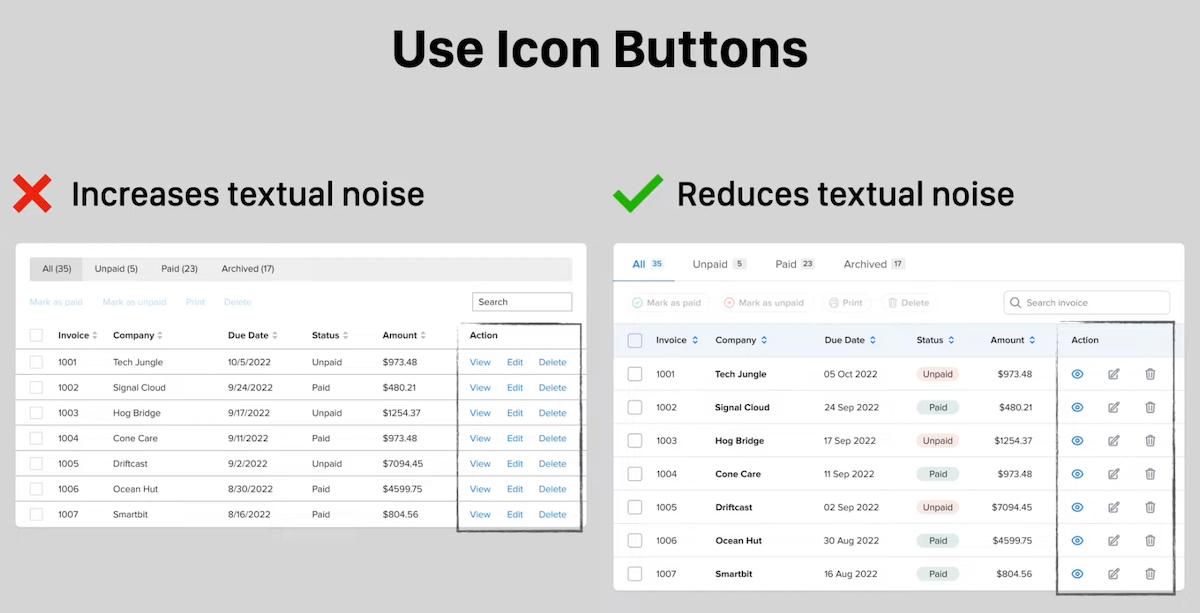
- Replace text with icons for statuses and actions
Click for a larger image, it will open in a new tab or window
Click for a larger image, it will open in a new tab or window
Build in flexibility:
- Allow users to freeze, reorder, hide, and resize columns
- Use expandable rows to allow users to reveal additional details
- Offer options for condensed, regular, and relaxed row heights
3. Focus on Interaction and Performance
With complex data tables, performance isn't just a technical concern, its a core design feature. These features make your tables more interactive and responsive:
Sortable columns:
- Add persistent sort icons (like small arrows) next to column headers
- Use prominent icons to indicate active sorting (ascending/descending)
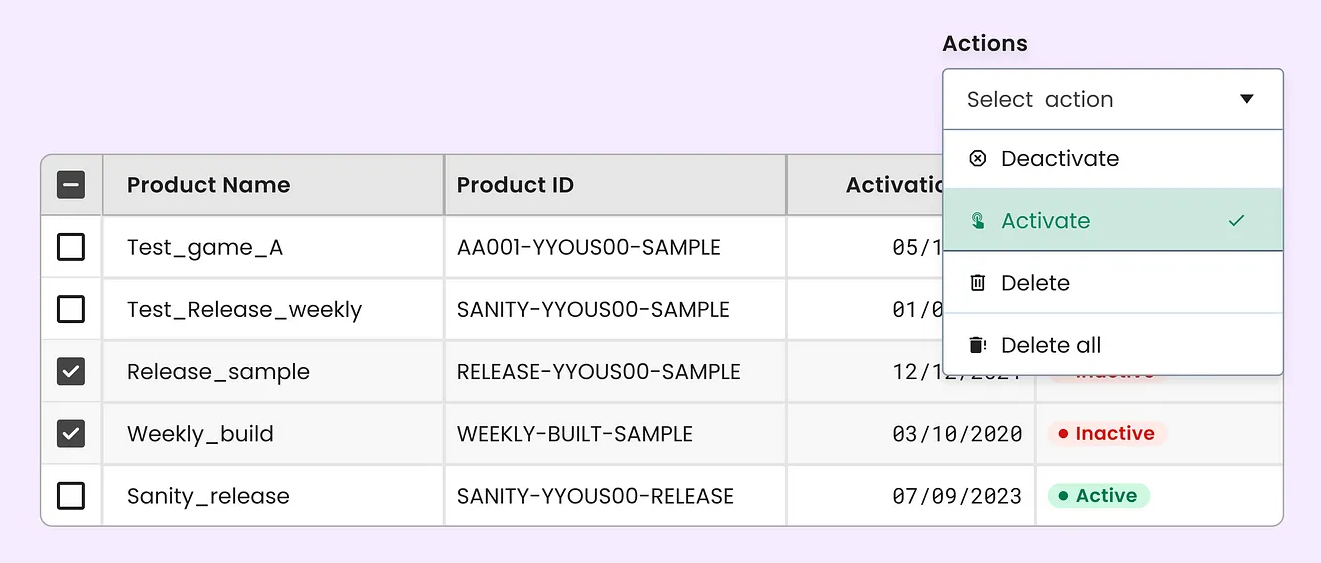
Multi-select and bulk actions:
- Include a select-all checkbox in the header and individual checkboxes for each row
- Display a sticky contextual action bar for bulk operations
Inline editing:
- Provide clear visual cues for active editing, like a highlighted border
- Offer obvious "save" and "cancel" options, either as buttons within the cell or through clear keyboard shortcuts (enter to save, escape to cancel)
Feedback and confirmation:
- Use subtle animations or color changes to confirm successful actions
- Implement confirmation dialogs for destructive actions
Click for a larger image, it will open in a new tab or window
Click for a larger image, it will open in a new tab or window
4. Building a Flexible Component System
A modular, flexible system for table components is the not-so-secret shortcut to maintainable, efficient, and adaptable tables.
This video (mindesigning video) shows you exactly how to create dynamic table components on Figma. A quick breakdown:
- Create reusable cells for different data types (text, numbers, dates, etc.)
- Combine these into column components to easily swap out different data types within a column
- Assemble full table components to easily create and maintain complex tables
- Utilize auto layout and flexible sizing for adaptability
5. Adapting for Mobile
Focus on the data itself rather than its tabular layout. Some techniques to try:
- Present each row as a compact card with key info
- Use a sliding bottom sheet for row actions and vertical accordions to stack columns/combine related columns to reduce horizontal scrolling
- Ensure touch targets are at least 44x44px
- Place pagination controls at both top and bottom
- Avoid hover-dependent actions that don't translate well to touch devices
Designing a complex table for mobile consumption (medium)
*Users don't usually expect mobile tables to look identical to desktop versions. But they do expect core functionality to exist on both. (where applicable)
*5.1 My Opinion on Adapting for Mobile
While the ux design article linked above covers all the bases and their points are good, I wanted to offer an alternative suggestion.
The overhead for complex mobile data tables is astronomical (outside of using some kind of pre-built framework) and how useful is working with all this information on mobile anyway? If the product ask is specifically that (like in the article), then good, you know your mission, execute! If not, make sure everybody understands the effort and time constraints.
- Opinion: Discourage the use of complex data tables at all on mobile. Tablets or Desktops are much better suited to handle this kind of information and at least make it easier/quicker to navigate. Maybe allow the table to be downloaded and viewed as a PDF/alternative.
- Opinion: Leave the tables as they are, don't use CSS or complex JS to stifle the data. Present it as it exists and let the user navigate it as it was meant to be presented. If that is pinching, sliding, scrolling, then so be it. At least the data is there and not hidden behind multiple clicks.
- Opinion: Accessibility is one of our upmost priorities, but careful how you present and introduce interactions with the data. Small devices with complex touch and interaction specifics are sometimes more hassle to overcome than the time and effort is worth.
If you have another opinion, challenge me, let's discuss it.
Effective table design balances power and simplicity. Start with the user needs first, focus on core functionality, and then adapt for different devices and interaction methods.
6. A Word on Accessibility
The more complexity you introduce in to your data tables the more diligent you need to be about presenting that data accessibly. There's comprehensive articles all over the web on how to build your tables accessibly. I've included a couple of links below to help guide the process.
6.1 Accessible Data Sorting
A question that has come up a few times is using icons to sort data in columns. A feature of just about all data tables is column sorting. Ascending / Descending should only require a click or tap and the data sorts live.
- Semantics - keep your HTML clean. Use the proper header labels (th)
-
Use aria labels to properly represent the actions accessibly -
aria-label="Start date: Activate to invert sorting"aria-sort="ascending"
W3 has a good article on their ARIA Authoring Practices Guide (APG) under Sortable Table Examples. It has a good example of sortable table implementation and patterns.